eMap is capable of identifying possible electron/hole transfer channels for a single protein crystal structure using a graph theory based model of the protein crystal structure (Single Protein Analysis). Additionally, eMap is capable of mining a group of protein graphs for common subgraphs for the purpose of identiyfing shared pathways/motifs (Protein Graph Mining). Each mining job submitted to the server is assigned a unique project ID, and the data from successful jobs can be accessed and visualized via the Load Project page. For instructions on how to use the different features of eMap, click on the collapsible panels below.
Enter a file from PDB database or upload your own
To fetch a file from PDB database, enter PDB ID. The .pdb file will be downloaded from PDB database directly and available for processing. Only files in proper .pdb/.cif formats will be accepted for uploading and processing your own file.


File processing
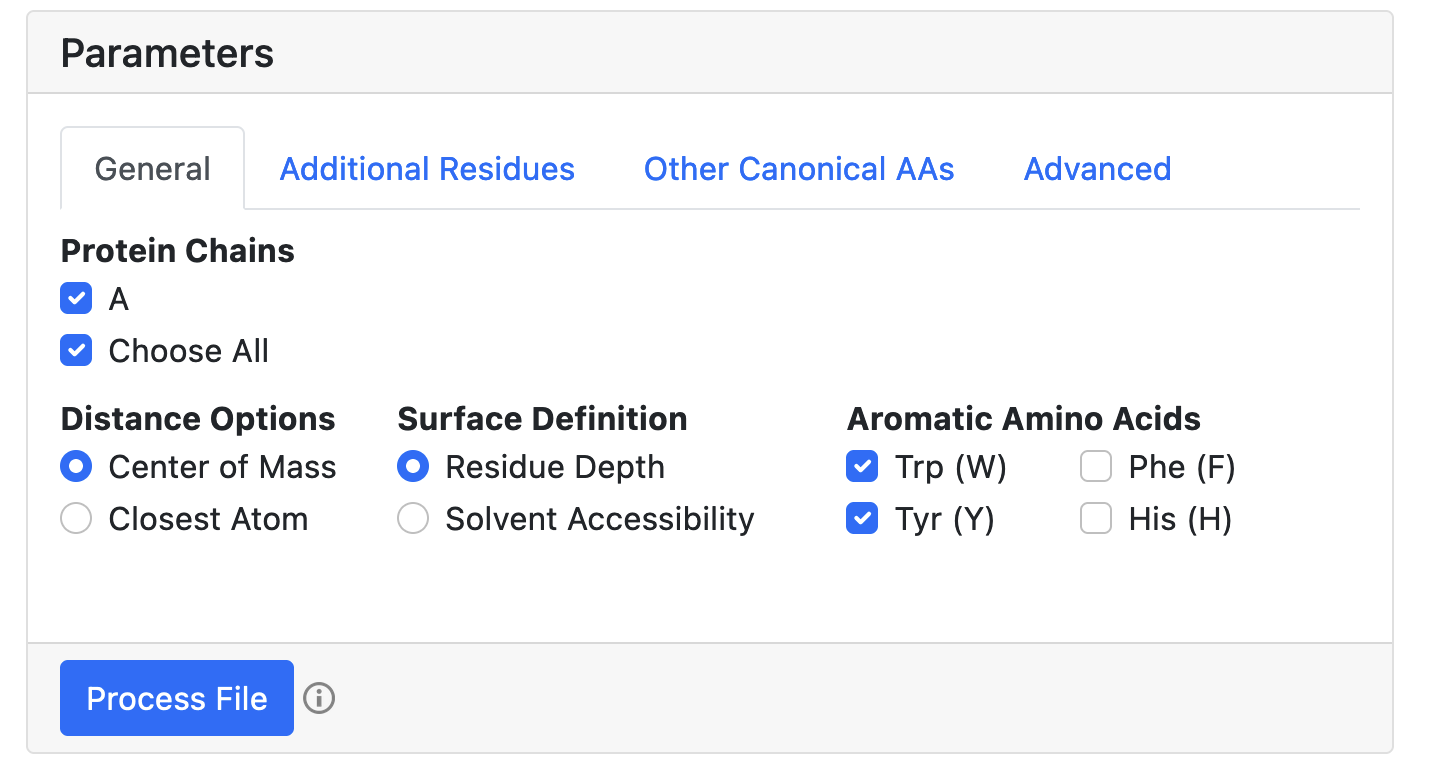
Specify options for file processing. Choose algorithm that is used to compute the pairwise distance matrix for building the graph: center of mass (default) or closest atoms. Determine, how the surface-exposed residues are identified: based on residue depth (default) or relative solvent accesibility. Pick the aromatic residues included in the analysis: Trp (W) (default), Tyr (Y) (default), Phe (F), His (H). Other canonical amino acids can also be selected in the "Other Canonical AAs" tab. By default, all protein chains are included. All automatically determined non-protein ET moieties are listed in "Additional Residues" tab and are included by default (see below). For the details regarding "Advanced" section, please refer to the manual. The preliminary graph with all connected nodes will be displayed below once "Process File" button is clicked.
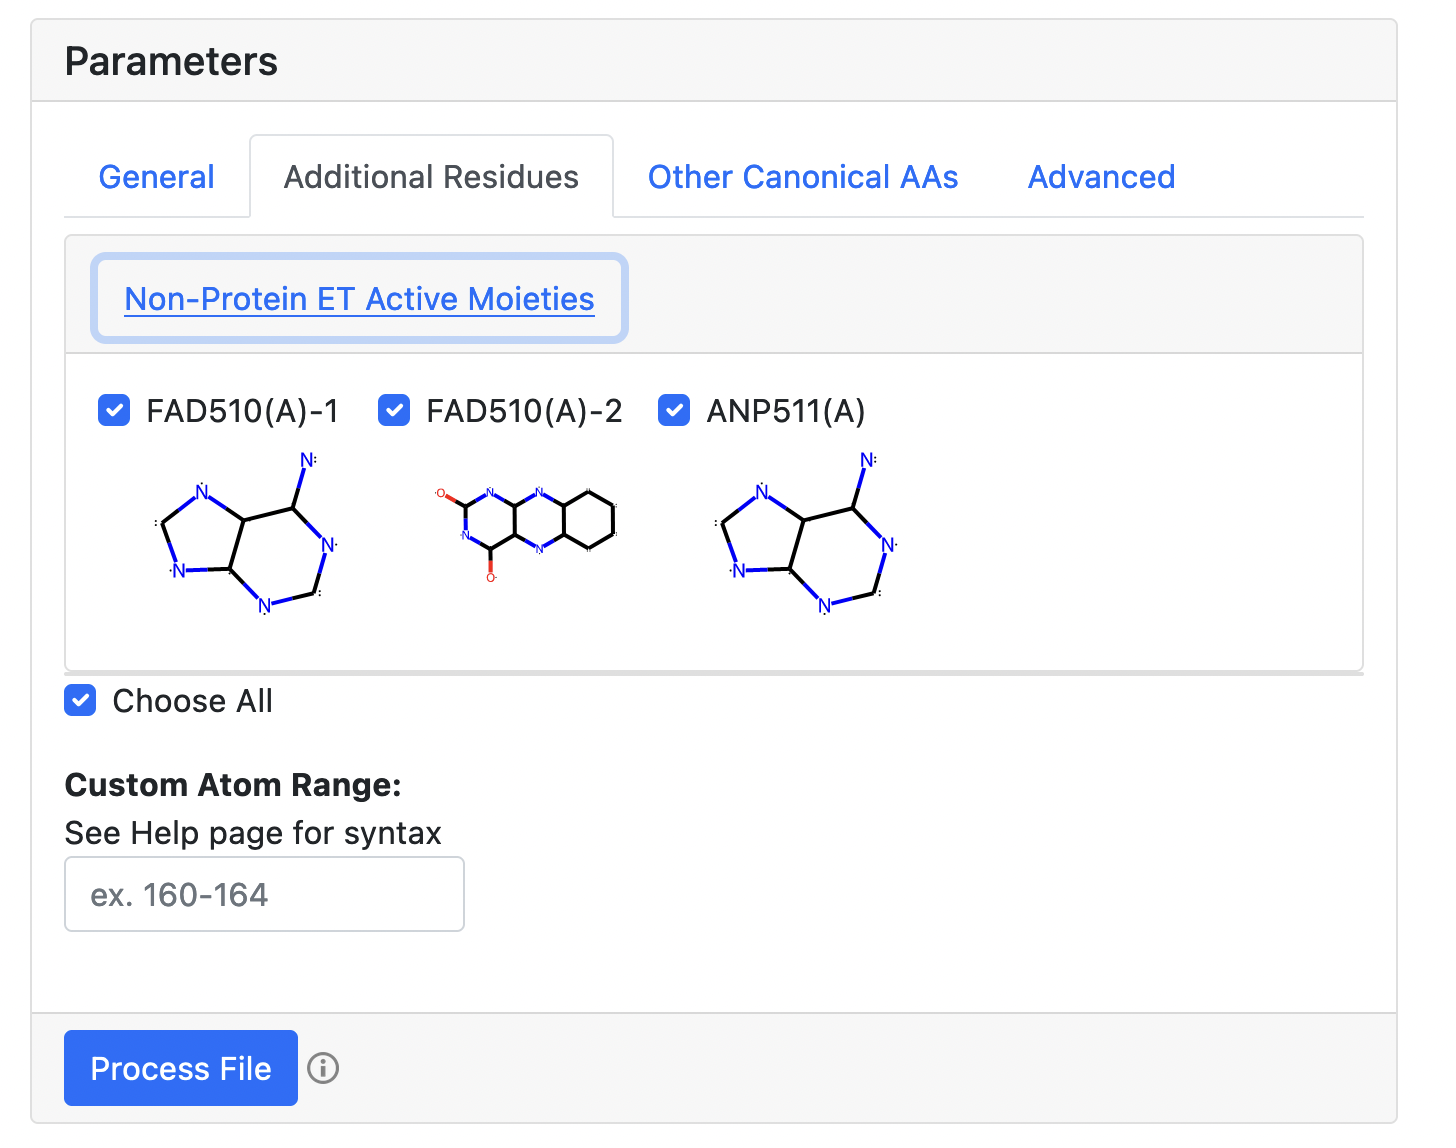
Optional: Additional Residues
All aromatic moieties with π-conjugated systems are automatically identified and included in the analysis. Additionally, a set of inorganic clusters and metal ions will also be identified. One can select/deselect them, and specify additional residues using the "Custom Atom Range" option. The syntax for the "Custom Atom Range" option is as follows. Atom indices for atoms belonging to the same custom residues are given in parentheses. Continues ranges of atomic indices are defined using "-", atomic indices and residues are separated with ",". For example, "(160-162,164),(180-185)" will define two custom residues: the first "160-162,164" residue will be labeled as "CUST-1"; the second "180-185" residue will be labeled as "CUST-2".
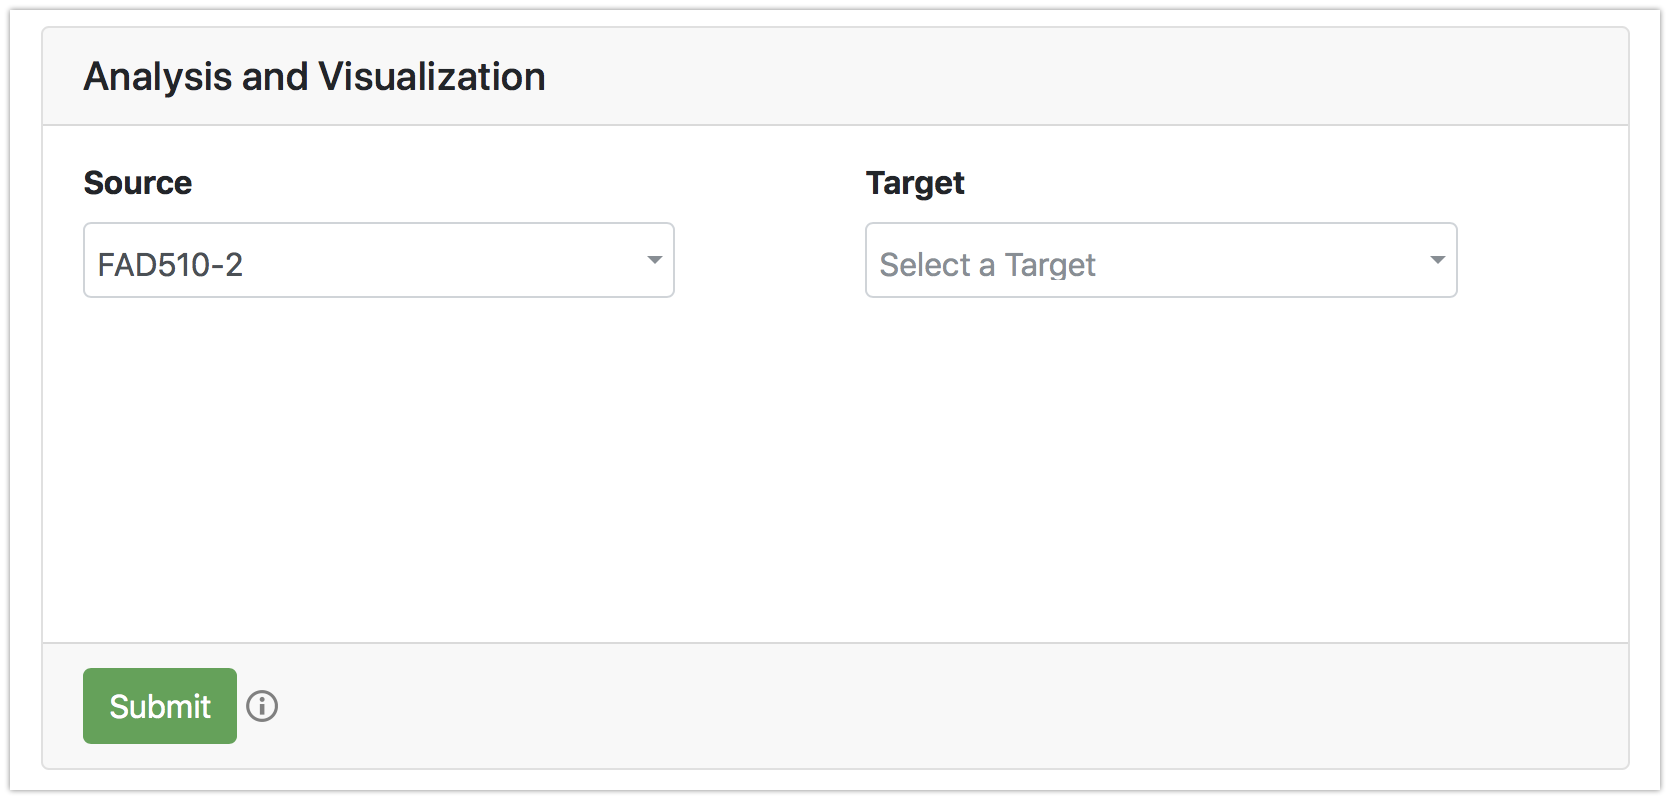
Specify source and, optionally, target
Once the file is processed, a valid source node for electron/hole hopping pathways should be specified. By default, when only source node is specified, electron/hole hopping pathways from the given source to the surface-exposed residues will be identified. Optionally, when the target is specified, 5 shortest pathways from the given source to the given target will be computed.
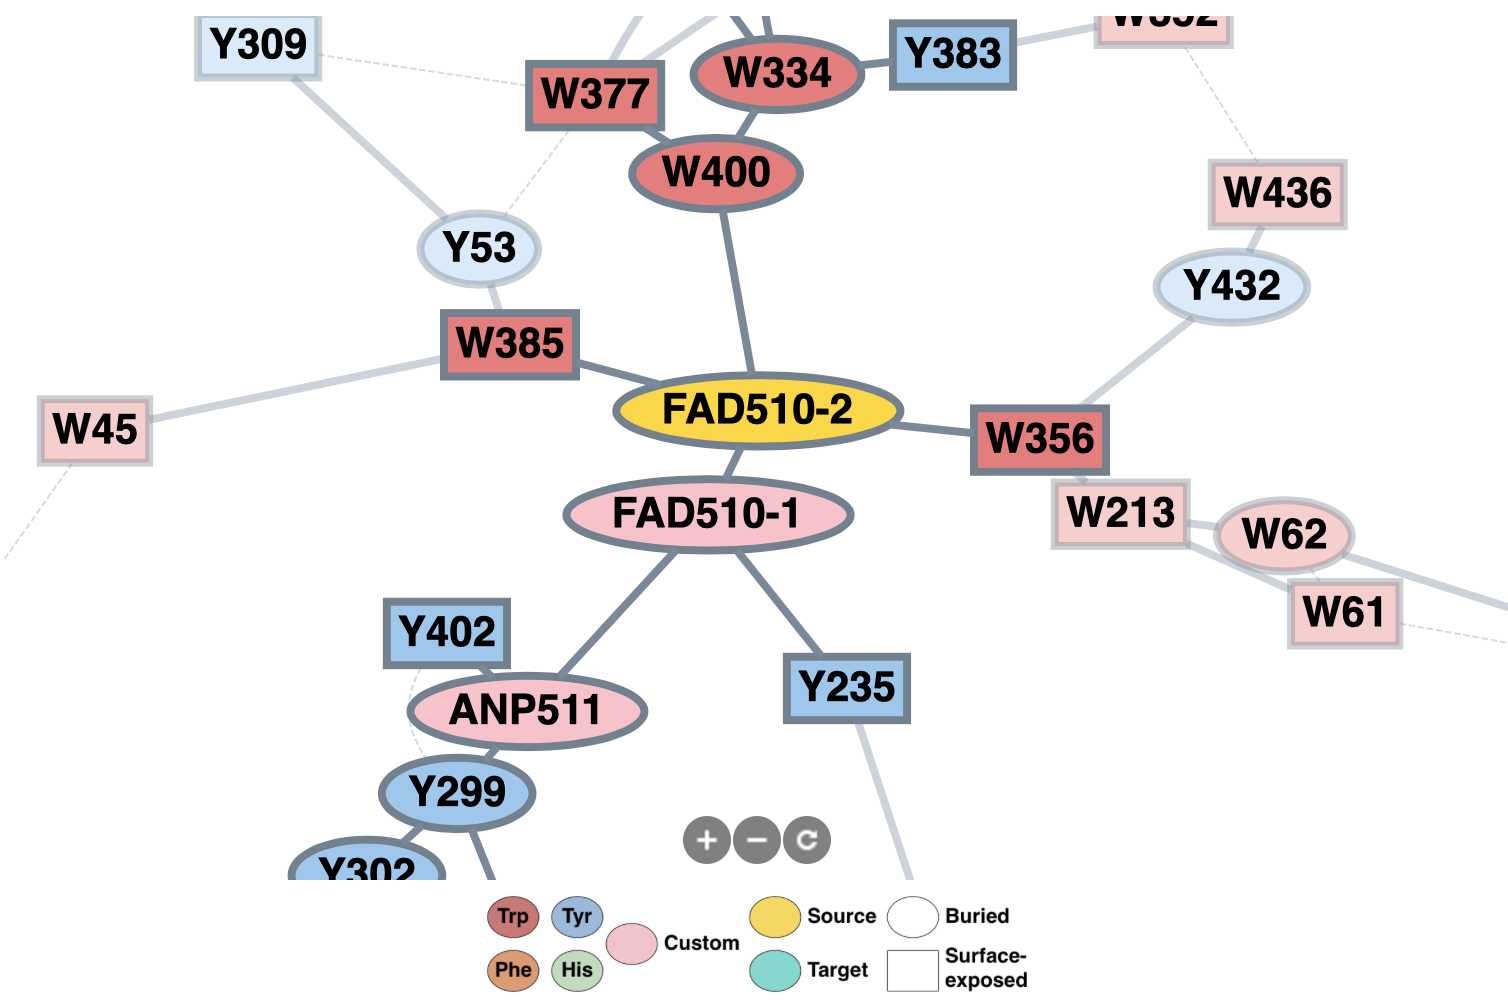
2D graph visualization
Predicted pathways are visualized on a 2D graph. The residues are color-coded accordingly.
3D visualization
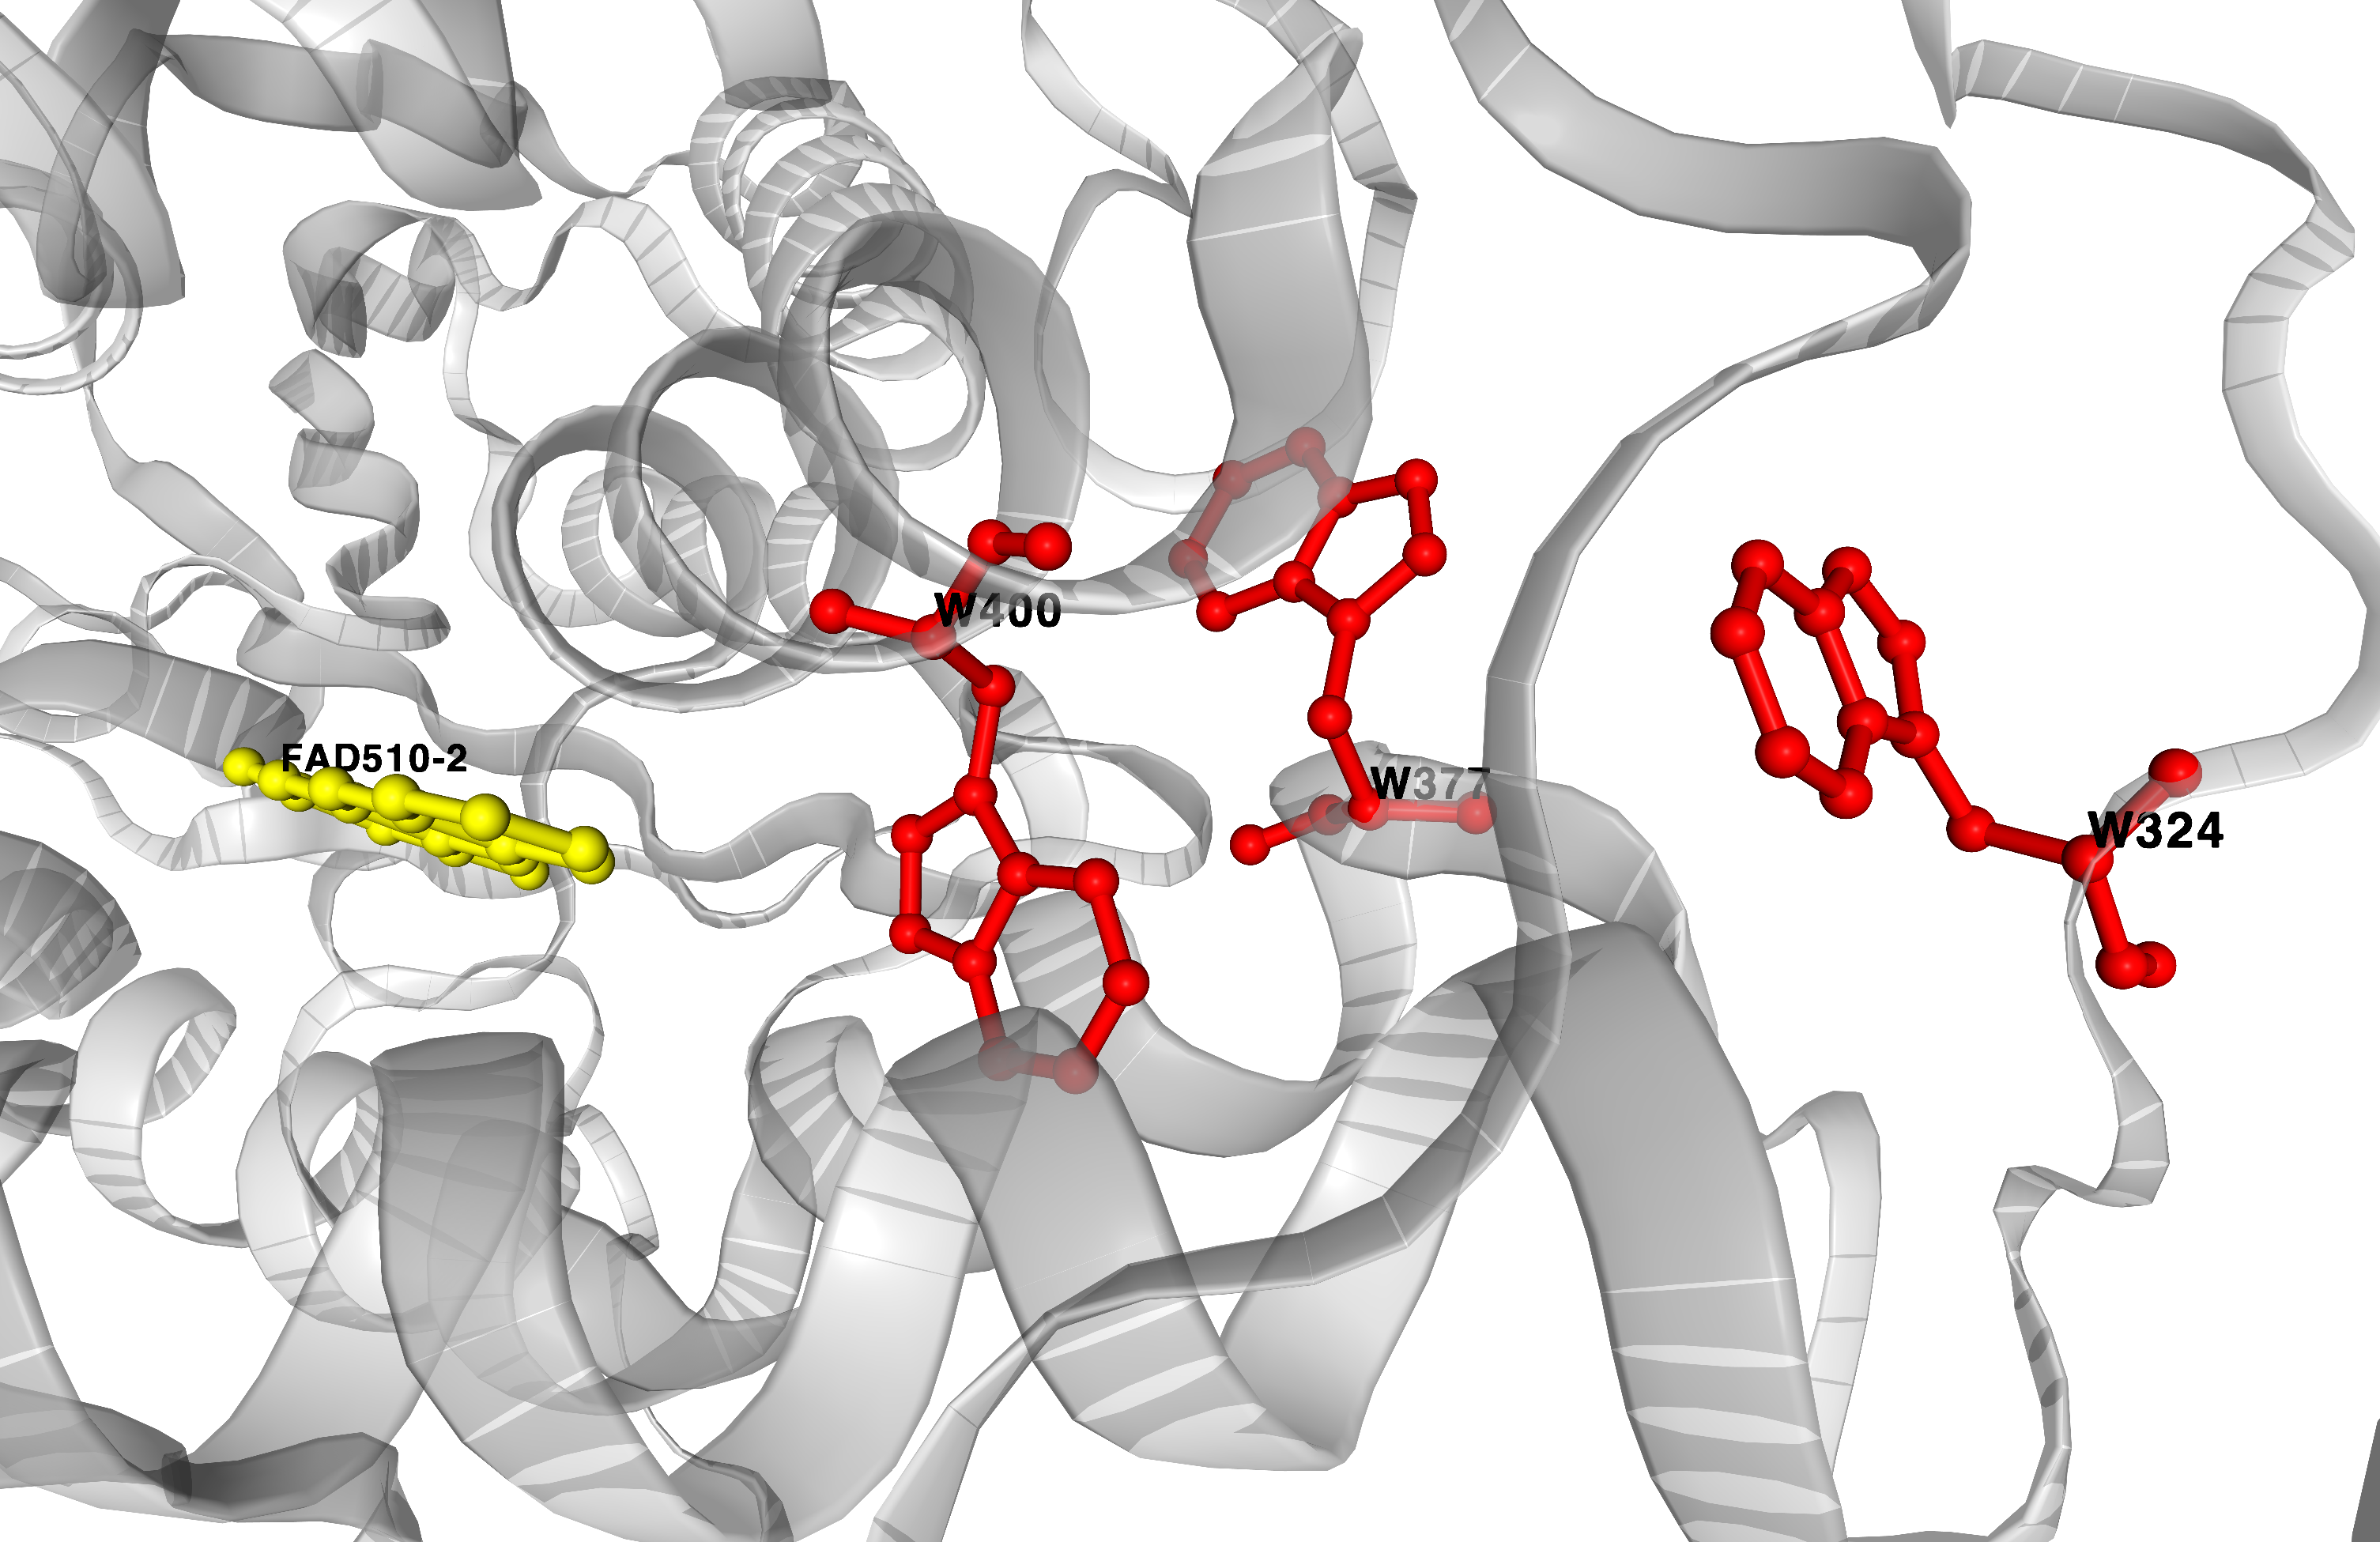
Computed pathways area also visualized in 3D using NGL viewer.
3D visualization options
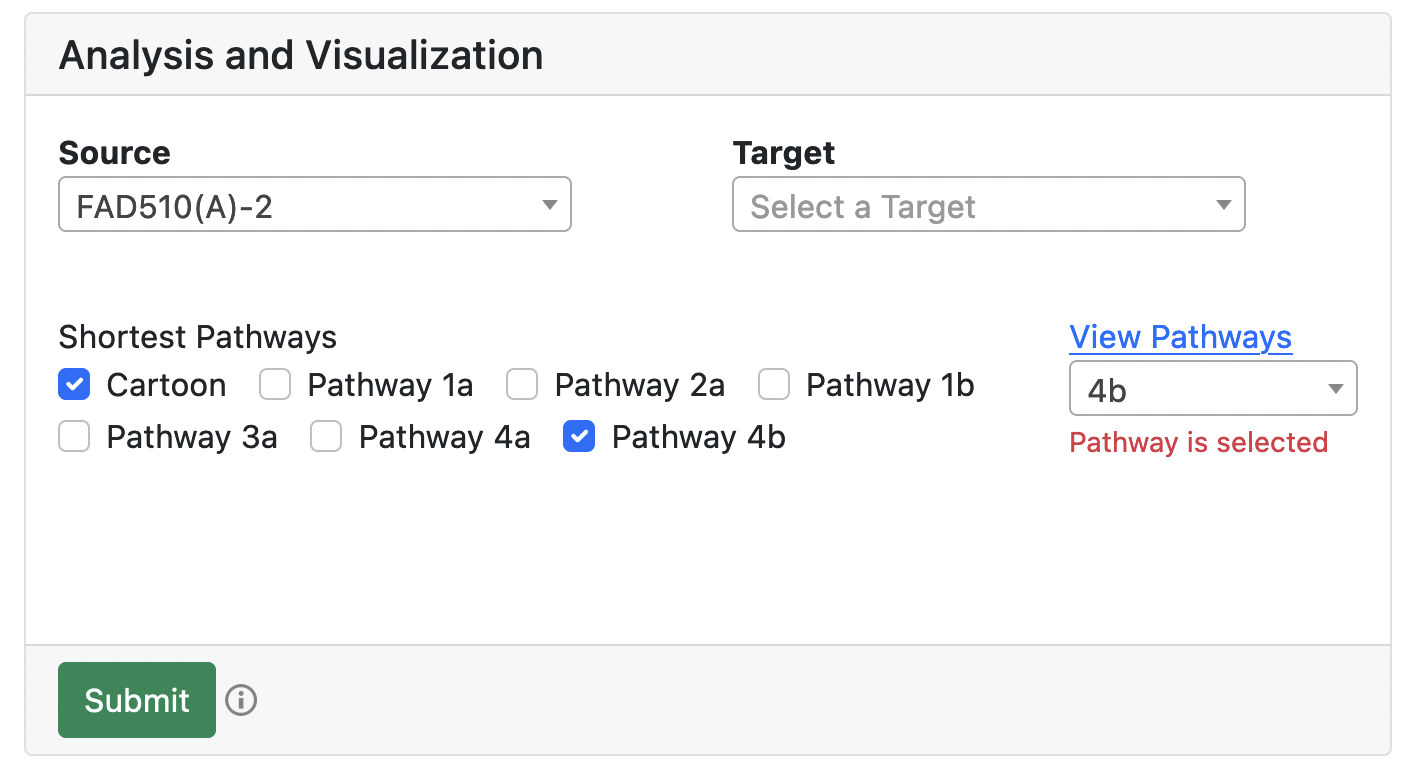
The user can select pathways for visualizaing in 3D using either checkboxes or provided list. All pathways and their IDs are provided in the table at the bottom of the page.
Last updated 01/31/2022
Enter list of PDBs to fetch, or upload list/zip
To fetch a list of PDBs from the PDB database, enter PDB IDs separated by commas. Alternatively, one can upload a .txt file containing PDB IDs separated by commas (which will then be fetched from the RCSB database), or a .zip archive containing valid .pdb or .cif files.


Processing and Mining
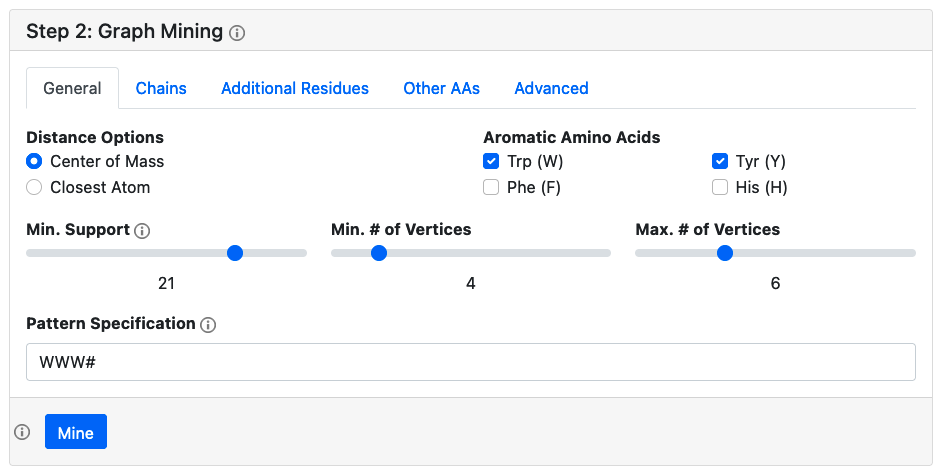
Specify options for generating the protein graphs, and then mining for frequent subgraph patterns. For protein graph generation, the options available to the user are identical to those in the single protein analysis. Be sure to specify which amino acids you wish to include, which chains to include. For mining, there are two types of subgraph pattern mining available. The default approach is to search for all possible subgraph patterns with a minimum support number, i.e. appear in a given number of PDBs. This approach uses the gSpan algorithm, and the larger the support number, the faster the calculation, at the expense of fewer patterns identified. The second is to search for all protein subgraphs which match a specified pattern (e.g. WWWW). In the subgraph pattern specification, the '#' character is used to denote a non-standard residue, and the '*' character is a wildcard.
Advanced Options
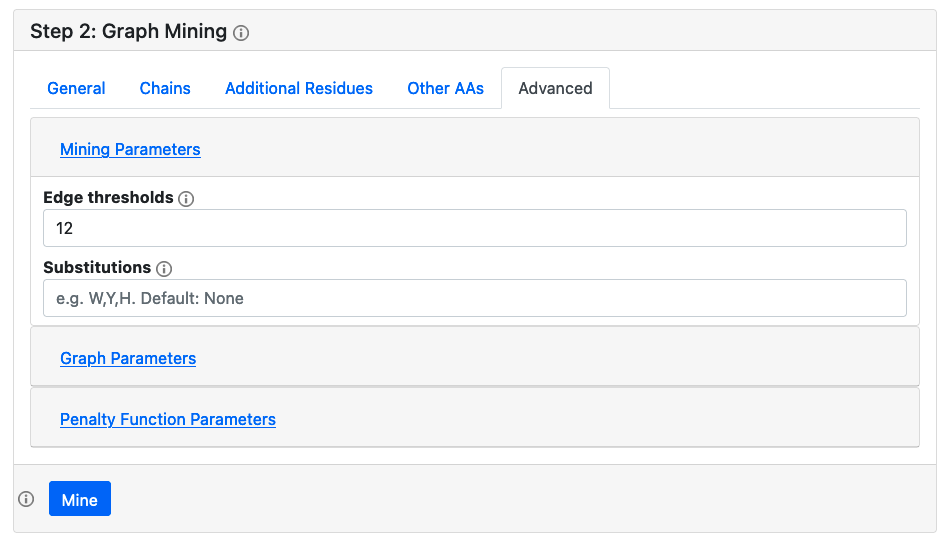
For graph generation, the advanced options are identical to those available in the single protein analysis. By default, protein surfaces are not computed, and therefore residues are not classified into buried/surface exposed, but this feature can be enabled. For mining, both nodes and edges can be classified into different categories for mining purposes. By default, all edges with weights < 12 Å are given the label '1', and those with larger weights are given the label '2'. This can be customized by specifying edge thresholds in an increasing comma separated list. For the nodes, by default each residue type is given it's own category, but one can allow for substitutions by listing only a few amino acid types in a comma separated list, and then the rest will be given the label 'X'.
Running a mining job
Clicking the mine button will add a job to the worker queue, and will generate a unique project ID. The user can wait for the job to finish, or copy the ID and access the results/receive status updates later by going to the Load Project page and entering the unique project ID. Mining jobs currently have a hard time limit of 10 minutes, and successful jobs will be stored on the server for 48 hours.

Frequent Subgraph Patterns
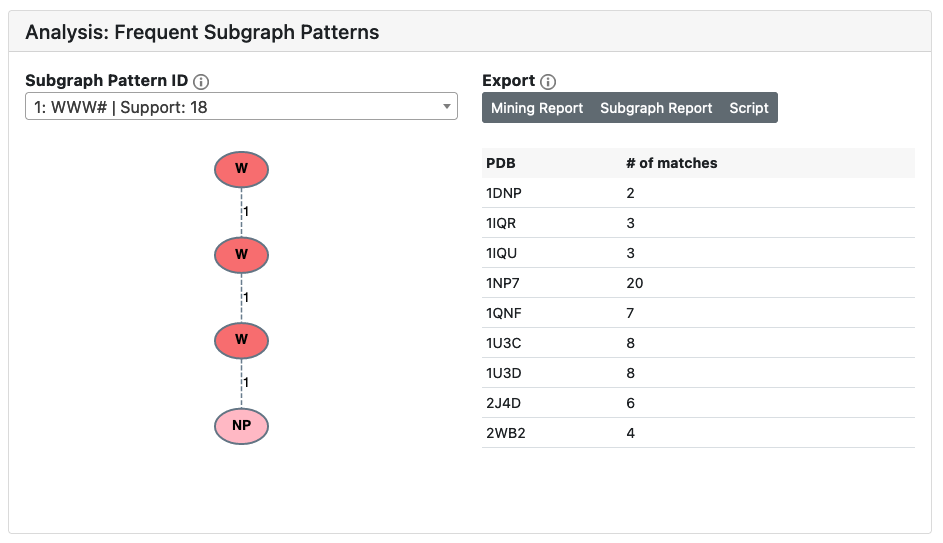
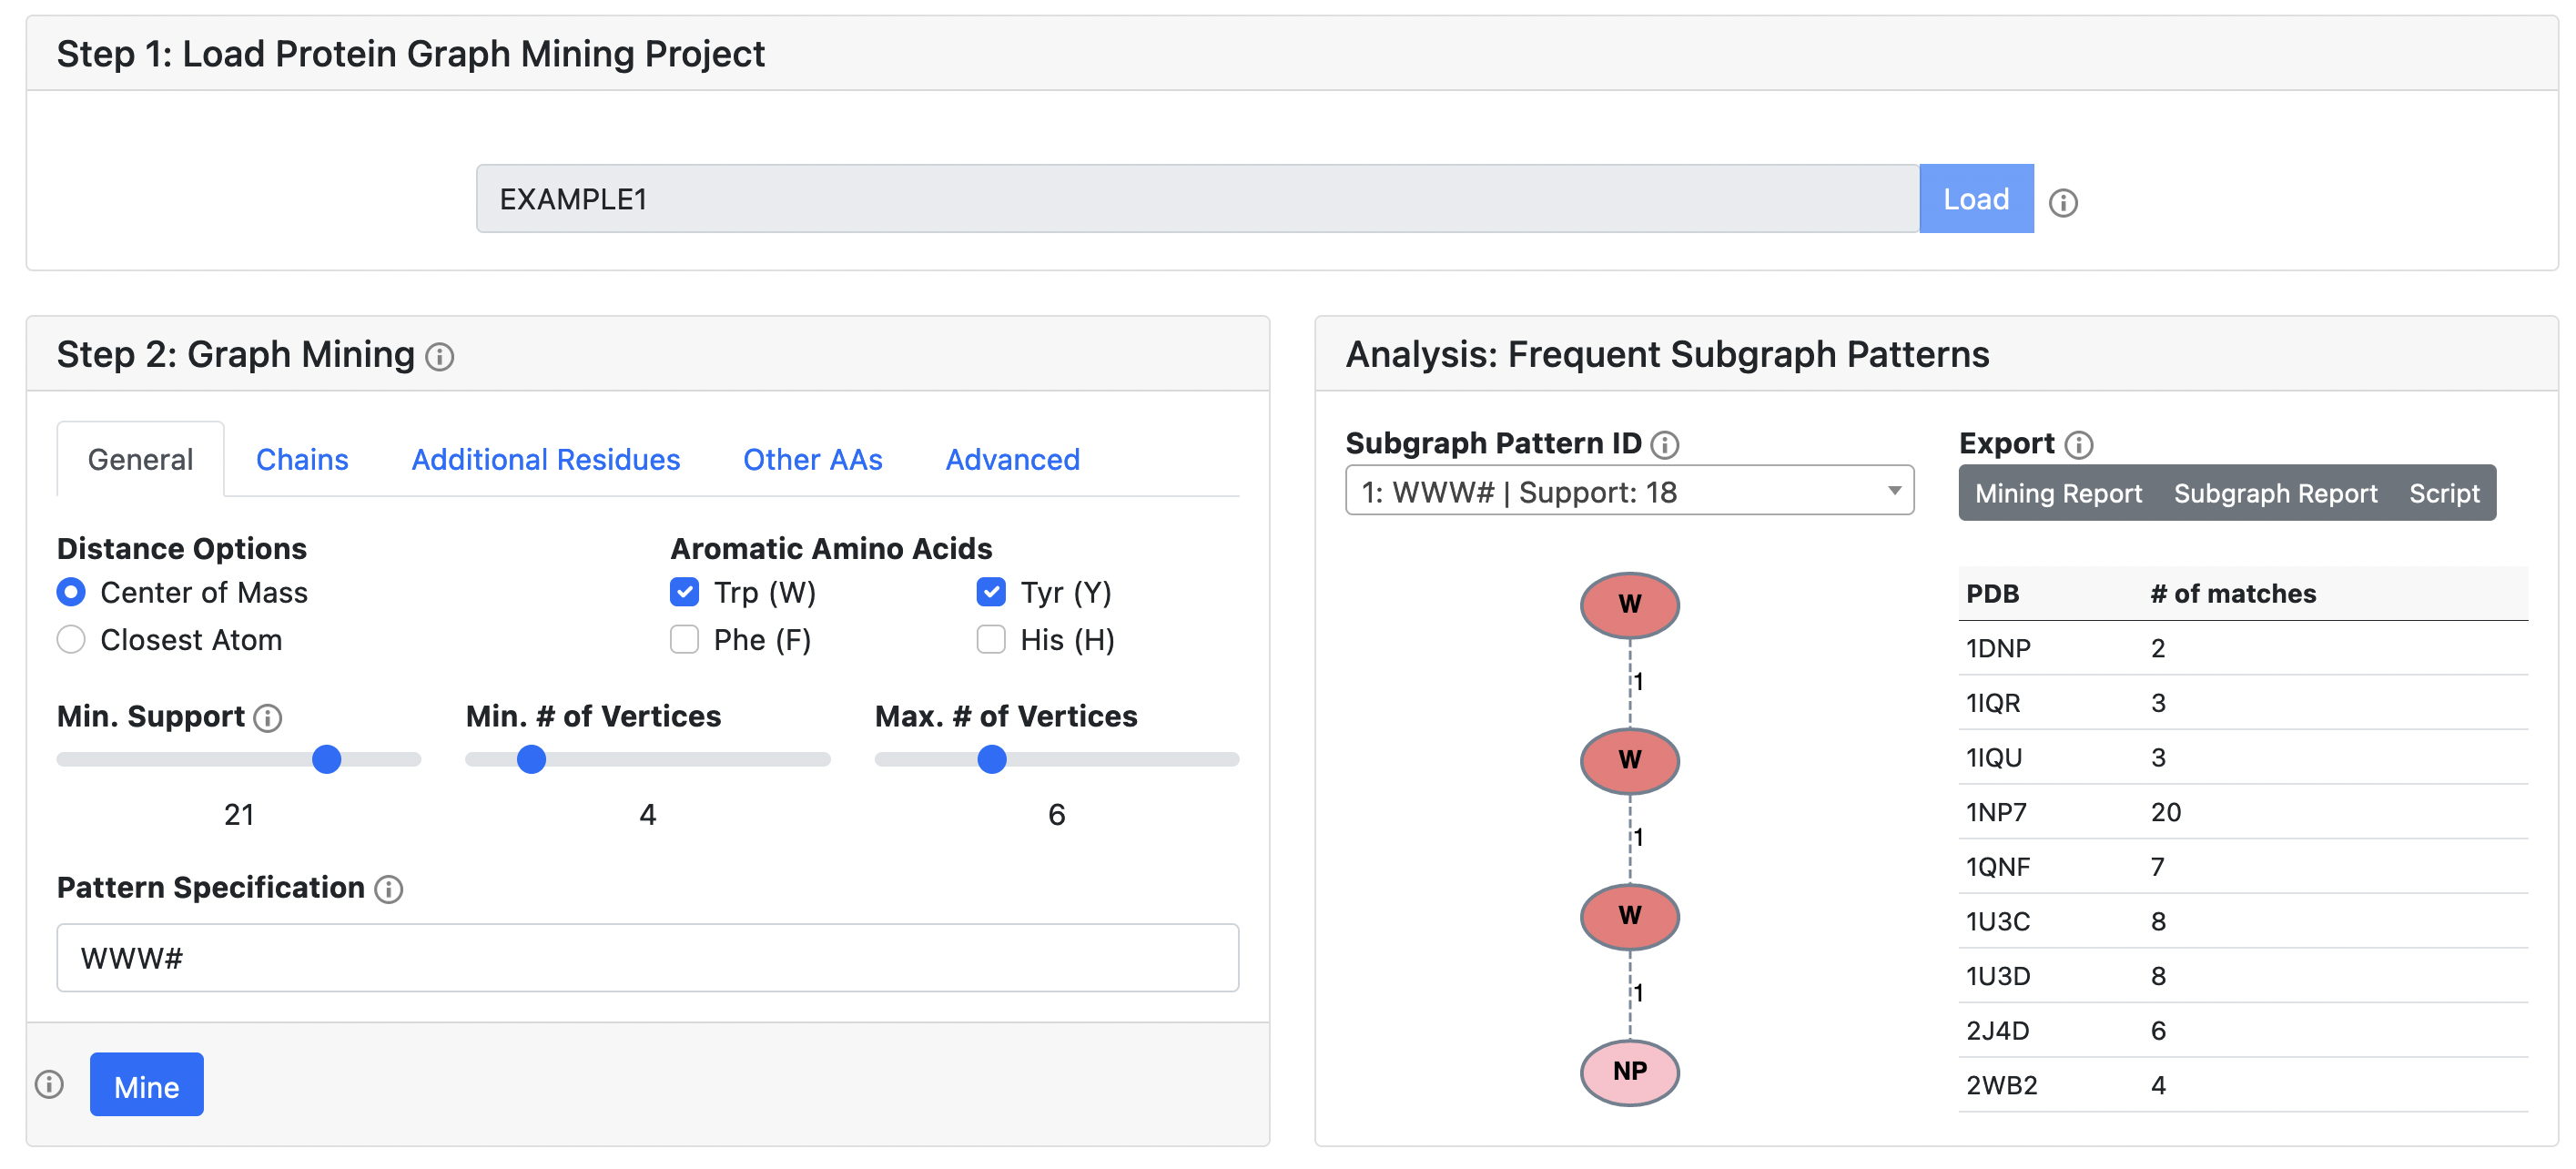
A successful job will identify a group of subgraph patterns, each of which can be further broken down into individual protein subgraphs (visualized in the next section). Each subgraph pattern is assigned a unique ID which based on its composition and support number. For the selected pattern, its occurences in each PDB is summarized in a table. Additionally, reports which summarize the results of the mining job and the selected subgraph pattern are available for download, along with an automatically generated command-line python script which reproduces the results using the PyeMap backend.
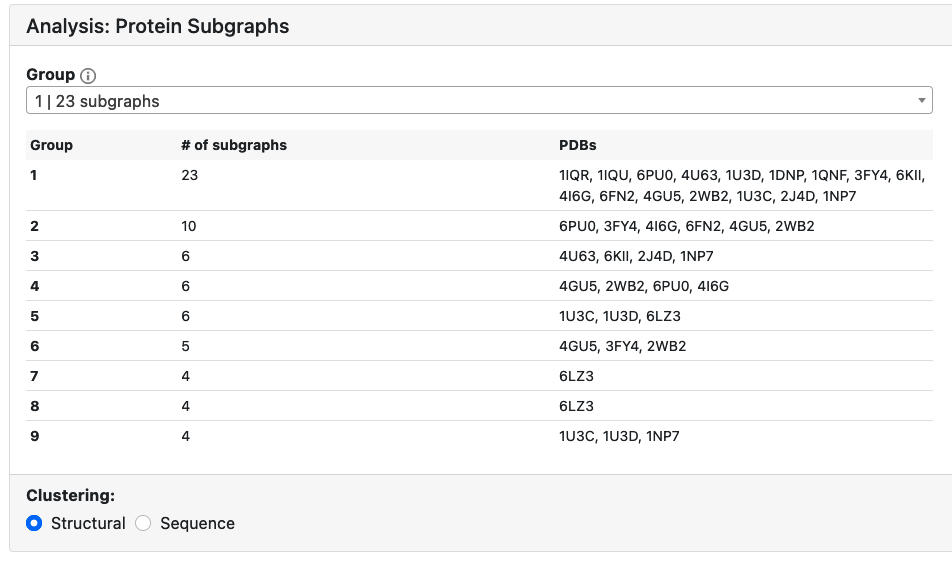
Groups
Protein subgraphs for the selected subgraph pattern are clustered in groups based on structural or sequence similarity. One can toggle between the two types of clustering to explore the similarities between subgraphs in different protein structures.
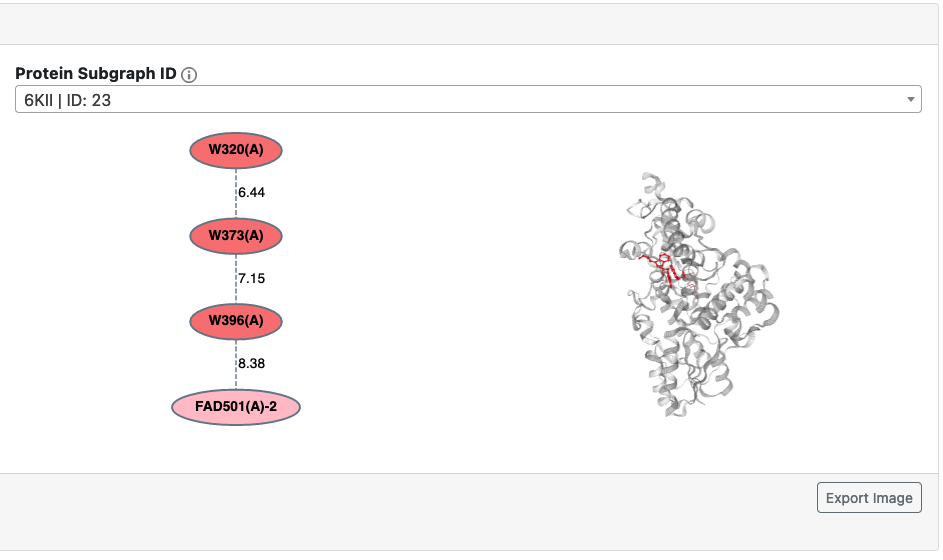
Protein Subgraphs
Protein subgraphs are visualized in a 2D graph representation, as well as in 3D using the NGL viewer. Each protein subgraph is assigned an ID based on the PDB and the group it was clustered into.
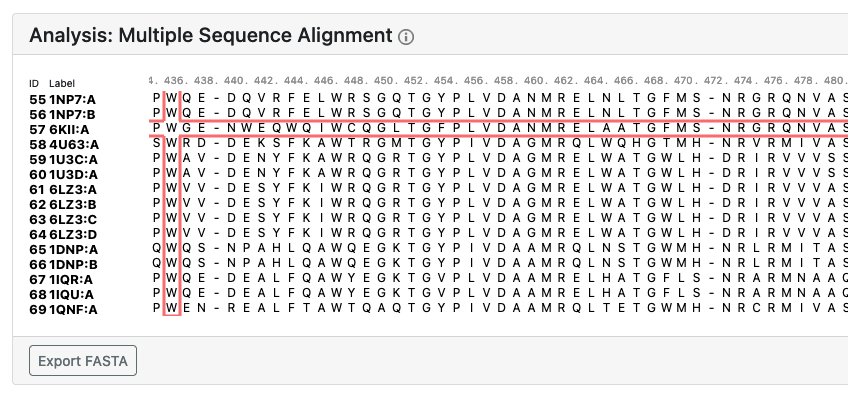
Multiple Sequence Alignment
A multiple sequence alignment performed by MUSCLE is automatically included in the analysis. The positions of the residues of the selected protein subgraph are highighted in the multiple sequence alignment using the MSA viewer.
Last updated 01/31/2022
Load from Project ID
Every mining job generates a unique project ID which can be used to check on the progress of the job, and to access the data for up to 48 hours after submitting the job. We provide the sample jobs 'EXAMPLE1' and 'EXAMPLE2' for the user to explore the functionality.

Interact with data
The parameters in Step 2 are restored exactly as you had them, and one can interact with the data exactly as described in the Protein Graph Mining section. One can also tweak the parameters and submit a new mining job (with a new project ID) without affecting the previously generated data. The original project ID will still work if a new job is submitted, and one can return to it for as long as the data is stored on the server (48 hours for user submitted jobs).
Last updated 01/31/2022
